Penalty Detection
1 - Introduction
Event detection is a field that has been growing the last few years and has been focusing a lot in the sports industry. There is a lot of demand for models that are able to determine actions, for example human action recognition its been growing in interest. As well, a lot of research is being done to create models that can detect actions in sports. In this project, I focused on football, which is the most popular sport and where all this technology is first being applied.
I completed my internship in Mingle Sport, a company that launched an app which applies Machine Learning to offer the users new experiences. The topic I have worked on is action recognition and as a first step I worked on penalty detection. This is novel because we deal with media files recorded with mobile devices so the data that we use is not from actual professional games, it is from recordings the user posts in the app with their phone. Football event detection on phone content is not a very explored field of research and I will keep doing research on this for my thesis.
Detecting actions from video is a difficult task but it is still more difficult when it is not just determining one action. Instead, for football, models need to interpret what is happening, therefore it is paying attention to a lot of details and situations. For this project, I created a model that is able to detect penalties, which means a binary classification problem. Bounding box information was extracted for each video and fed into an LSTM network.
The code can be found following this link: https://github.com/diegomartiperez/Penalty-detection.git
2 - Activities
During the internship, a variety of tasks and challenges have been faced and solved. First, after the choice of the topic, some time was spent on doing research on event detection and finding what the state-of-the-art alorithms were. This was helpful to clarify what was possible in this field and which was the way to go.
In order to build a model and perform this penalty detection challenge, data is needed. Therefore, I created a dataset on my own with clips recorded from mobile devices. These videos were labelled with two classes.
Once all this data was ready, for obtaining bounding boxes of each video, an object detector (yolov5) ran through all the videos, which gave text files containing the bounding box information for each frame as output. Later on, preprocessing of the data was needed to feed this information into the model. Finally, several experiments were conducted with different parameters and thresholds.
This topic is relevant because there is a lot of demand on event detection in football and there are a lot of companies trying to build these technologies. This project is a starting point to a more complex task of detecting all the actions in a football match: shot, foul, pass, throw-in, penalty, etc. This could be used for highlights of matches.

3 - Method
3.1 - Data creation and Labelling
For this task, data is needed to train the model. As I did not find any dataset online containing penalties recorded on phone, I created my own dataset. Therefore, I recorded a total of 185 videos where some of them are penalty shots and others are just other random actions such as dribbling with the ball or passing. These clips were recorded in two different locations and with many different camera angles (in front of the goal, on the right side, close, far, etc). These videos were all labelled in Dataloop [1]. Consistency in the labelling process is key for the model to understand when there is a penalty action. There are two labels: penalty-action and no-action. Penalty-action is when the player starts running towards the ball in order to shoot and finishes when the full trajectory of the shot has been seen and we can tell it was or not a goal. The rest moments of the videos are labelled as no-action.
3.2 - Data Preprocessing
For all the videos in the dataset I ran an object detector in order to obtain bounding boxes, which will be the data fed into the model. These were obtained by running yolov5 on every video. YOLO (”You only look once”), is an object detection algorithm that divides images into a grid system. Each cell in the grid is responsible for detecting objects within itself. After running this yolov5, bounding box text files were obtained for every frame of every video.
The preprocessing part was a lot of work because it required to access all the bounding box information of every frame and combine it together to get the desired format for the model. As explained later, LSTM is good when dealing with time sequences. Therefore, for this problem I decided to make sequences of 10 frames. This means that each sample is an array containing all the bounding box information of 10 frames of a video. In addition, for the model to learn, each sample was assigned a label, which was obtained by looking at the label itself of the corresponding sequence. Labels are converted to numerical so no-action is labelled as 0 and penalty as 1. To sum up, the data that is fed to the model consists of samples of 10 frames where each of them comes in the form of a label and the combination of arrays of each frame.
3.3 - Dataset
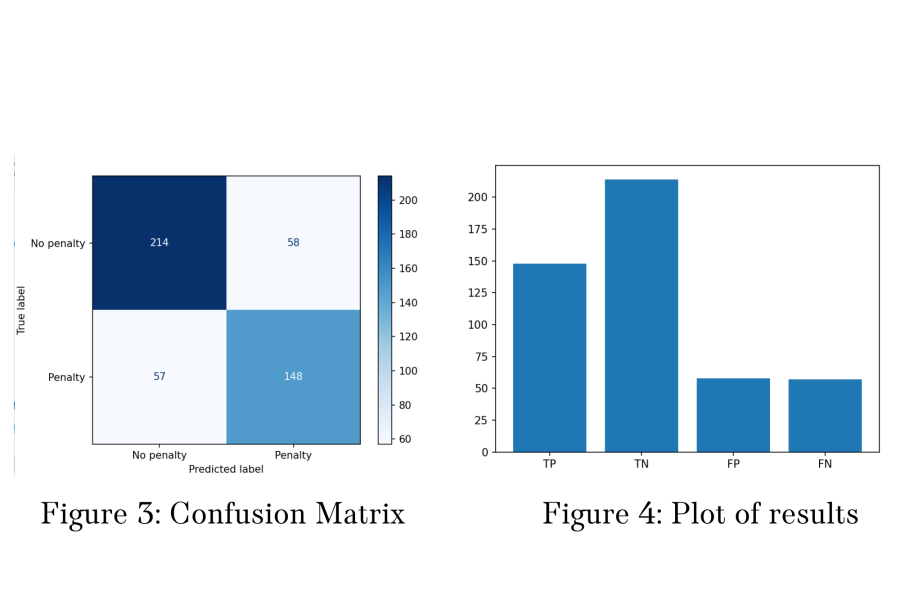
After the preprocessing of the data, it ended up with a dataset of 5282 samples. 166 videos where used as training data whereas 19 for testing, this way the test videos are all new for the model. There are a total of 1934 penalty and 2871 no-penalty samples for train and 205 penalty and 272 no-penalty samples for test. In addition, 20 % of the training data was used for validation.
3.4 - Model
This is a time-related problem since the data are videos, which are basically sequences of frames. Therefore, Recurrent Neural Networks (RNN) are perfect for this type of problem. For example, in [4] the authors make use of LSTM to classify actions of video sequences. Long Short Term Memory networks, also called LSTMs, are a special type of RNN. They are very good at learning and remembering information for long periods of time. They have a chain-like structure, but the repeating module has a different structure than RNNs. Instead of having a single neural network layer, there are four. The cell state is key and it is where information flows. The LSTM has the ability to remove or add information to the cell state, carefully regulated by structures called gates. They are composed out of a Sigmoid neural network layer and a point-wise multiplication operation. This layer outputs numbers between zero and one, describing how much of each component should be let through. A value of zero means that the information is not important while a value of one means that it is important and it flows towards the cell state.
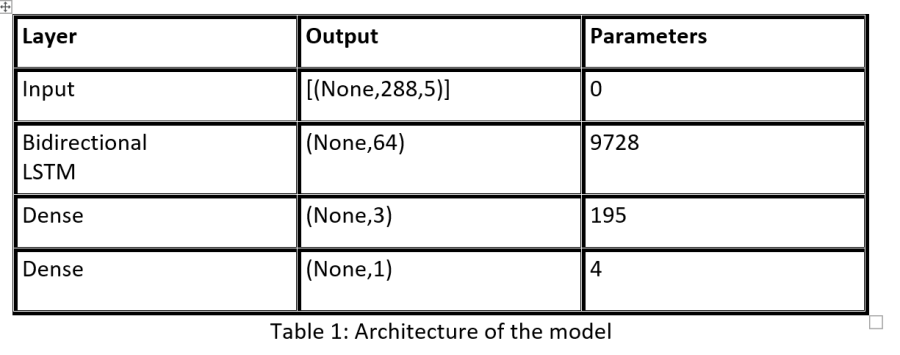
For this problem, an LSTM network was used. The architecture of this model, which can be seen in Table 1, contains a Bidirectional LSTM layer followed by two Dense layers. A Bidirectional LSTM is a sequence processing model that consists of two LSTMs: one taking the input in a forward direction, and the other in a backwards direction, this allows the input flow in both directions to preserve the future and the past information. The output layer contains a single neuron in order to make predictions. It uses the Sigmoid activation function in order to produce a probability output in the range of 0 to 1 that can be thresholded to obtain class values. The loss function used is binary cross-entropy. In addition, the optimizer is Adam and class weights were used giving double weight to penalty-action, the minority class.
4 - Results
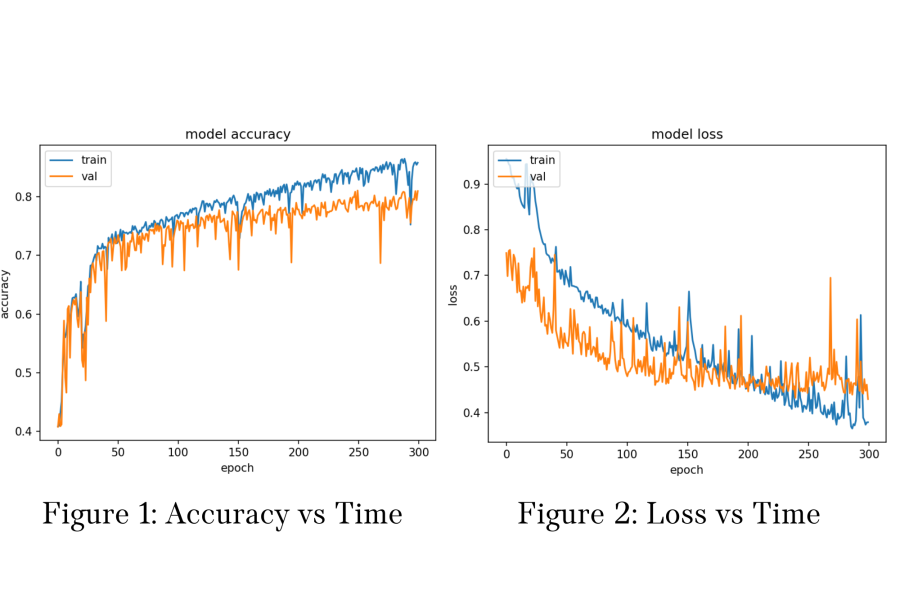
The output of the model is a number between 0 (no-penalty) and 1 (penalty). Therefore, when the prediction of the model is closer to 0 it means that the model recognizes that there is no penalty and if it is closer to one it thinks it is a penalty. In Figure 1 and in Figure 2 it can be observed the behavior of the model in terms of accuracy and loss respectively. From these plots we can conclude that before epoch 150 the model is learning new features quickly and improving its performance but after it slows down in the improving and drops down on the loss a little bit.
The results of the network can be observed in Figure 3 and Figure 4. Here, the confusion matrix is displayed showing the amount of true positives, true negatives, false positives, and false negatives. Positive samples are those which label is penalty and negative are those which label is no-action. Besides the confusion matrix, another view of the results shows in form of a plot this data. The model achieves a total of 76% accuracy, 0.21 false positive rate, and 0.27 false negative rate.
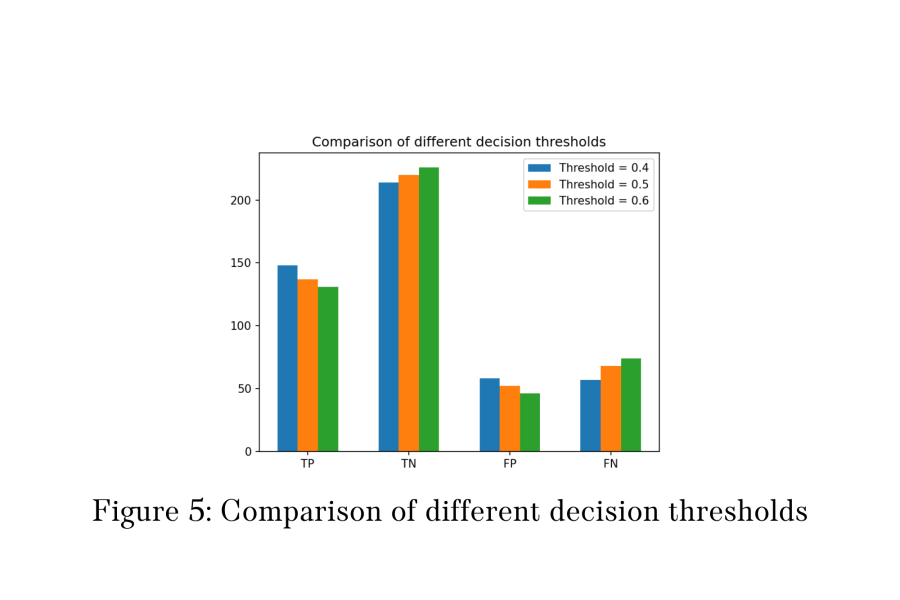
The table below contains a comparison of the results based on the decision threshold. Here it is shown how the model behaves for threshold of 0.4,0.5, and 0.6 respectively. It makes sense that the higher the threshold, the less false positives but more false negatives, and the lower the threshold is, the higher amount of false positives and less amount of false negatives. Therefore when increasing the threshold we obtain a higher sensitivity or true positive rate, which means more predicted penalties will be correct but more of them will be missed. On the other hand, with lower threshold we obtain higher specificity or true negative rate where more penalties will be detected but also more mistakes.

For the 3 experiments the accuracy is very similar, being 0.4 threshold the one with the highest. In terms of False Positive Rate and False Negative Rate it can be observed how as one increases the other one decreases and viceversa. In Figure 5, a graph of these results is displayed.
5 - Conclusion
Event detection is such a broad field and it is very complex to recognize very wide different actions. For this project I tried to come up with a simpler problem and test if it is possible to detect penalties using Machine Learning. It came up to be true by getting an accuracy above 75%. In addition, differences in terms of performances depending on the decision threshold were studied and it was seen how this affected the final outcome.
6 - Reflection and Evaluation
During this time at Mingle Sport I have learned a lot. Not only about Data Science things itself but also it was great to see how it is to work with the Machine Learning team of the company. We met on a daily basis and in these meetings we discussed our progress and talked about any struggles we had. It was nice to see how a whole company works for the same purpose and how they help each other.
In this process there have been harder and easier times. At first, I struggled to address a topic where I was comfortable and I was not sure if this project would be my thing. But after some weeks doing research and learning about video action recognition it was more straight forward. A difficult moment also was when I ran the model for the first few times and it was not giving the results I expected. Then I was asking myself if I was doing the right thing or if it was just not possible to detect actions based on bounding boxes.
Thankfully, after a lot of work I got over these difficulties and could get very decent results for this problem. This makes me very enthusiastic about this topic and this is why I will be doing my thesis in Mingle Sport also.
7 - References
"Dataloop AI: The data engine vor AI" , https://dataloop.ai
"Yolov5" , Github, https://github.com/ultralytics/yolov5
Ritesh Ranjan, "Long Short Term Memory (LSTM) In Keras" , Towards Data Science , 12 Apr 2020.
M.Baccouche, F.Mamalet, C.Wolf, C.Garcia, A.Baskurt, "Action Classification in Soccer Videos with Long Short-Term Memory Recurrent Neural Networks", ICANN 2010. Lecture Notes in Computer Science, vol 6353.


